Leica M Monochrom
The introduction of the Leica M Monochrom has raised many questions and comments from a diverse range of sources. On the positive side people attest the camera a sharper image than the RGB-images made with the Leica M9(-P), lower noise and higher useable ISO values. Leica photographers prefer black and white, are obsessive about sharpness and like to take pictures in low ambient light, loathing the use of flash. The Monochrom seems to be designed to address these demands. One renowned Leica photographer even argues that the Monochrom will end the conflict of choice between color or BW, because the Monochrom only has BW so there is no choice. This is a peculiar argument: with any digital M camera you can pre-visualize in black and white, make the picture in RGB and process in Silver Efex Pro, DxO Filmpack or any of the other specialized conversion programs to create a monochrome image. First reviews of the prototype camera note that the main argument in favor of the Monochrom is a psychological one: loosing the ability to shoot in color forces the photographer into a discipline that visualizing and and shooting in black and white provides. If this argument were correct one would see a digital version of the Zone System soon. The second (and mostly hypothetical) argument in favor of the Monochrom is the alleged high resolution of the sensor, some claims even putting the gain in resolution to 100%!
The reviewer in the Frankfurter Allgemeine Zeitung (FAZ) points to a curious contradiction in the Leica strategy: the Monochrom has been positioned as the true and original black and white digital camera that is capable of producing excellent monochrome pictures with a press of the button, but in addition provides the photographer with the very capable Nik Silver Efex Pro 2 that is hardly needed for processing the Monochrom files and can do wonders for the RGB images made with the M8/9 cameras. The reviewer remarks that the exhibition of images made with the Monochrom show a hefty amount of post-processing. The somewhat sober conclusion notes that the Monochrom will be a topic for discussion mainly at the 'Stammtisch' the proverbial round table of L-fans.
My first impression of the Monochrom is of a camera that combines digital convenience with silver-halide emotion, a very tempting combination. The assumptions and claims (technical and psychological) have to be verified or refuted by prolonged use and detailed testing.Classical film tests have a standard layout: one discusses the resolution/definition of the emulsion, the tonal scale and contrast bandwidth and the granularity or grain impression. In addition the actual exposure index and the characteristic curve are established. This sequence I will follow.The test situation is as follows:
Cameras: Monochrom and M9-P, both fitted alternately with the same Summicron 50 mm lens, stopped down to 1:5.6, distances from the test chart are 1.5 meter, 2 meter and 3 meter. Cameras placed on heavy Gitzo tripod. Exposure is bracketed with 0.5 stops and the focus has been bracketed by 1% of the distance setting. The best result has been selected, but care has been taken to ensure that results can be compared within reasonable margins. If the best focus for one camera is within 1% of the manual focus setting, it would not be very helpful if the other camera would get the best result at a 3% deviation. In that case the adjustments are not within tolerance. Both cameras worked within the 1% limit, so the comparison is valid. The limiting resolution for the M9-P has been established at 53 linepairs/mm. This is the expected result: the Nyquist frequency is 73.5 linepairs/mm and the useful limit has been found in previous tests to be at 70% of that value (= 51.5 linepairs/mm).
Under identical conditions (same lens, same test chart, same distance and same lighting) the Monochrom reached 68 linepairs/mm. In both cases the average between the just noticeable and the good visible values has been taken. The Monochrom then has a resolution that is 25% better than the M9-P (or the M9, M8, Titanium). This is consistent with the observation that the Bayer pattern reduces the maximum resolution by 30%. This improvement is significant, but one must add that careful focusing and a stable position are required.
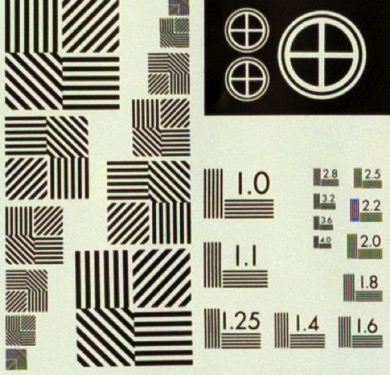
Below: resolution M9 (small section of full frame)
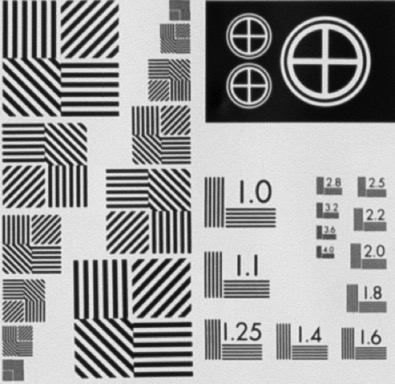
Below: resolution Monochrom (small section of full frame)
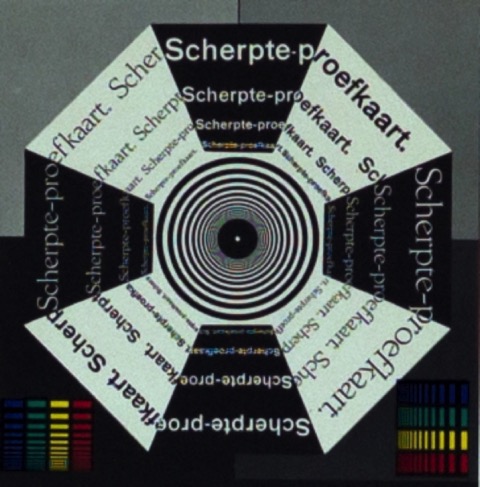
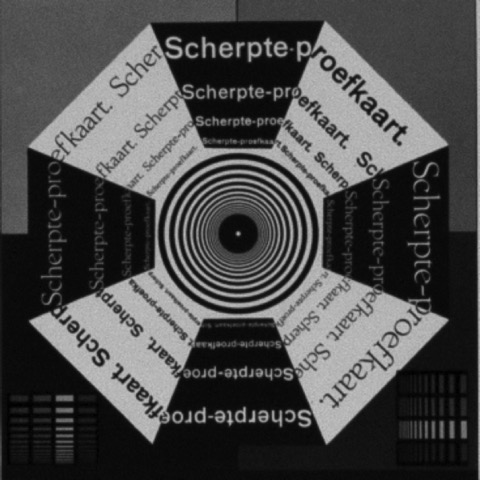
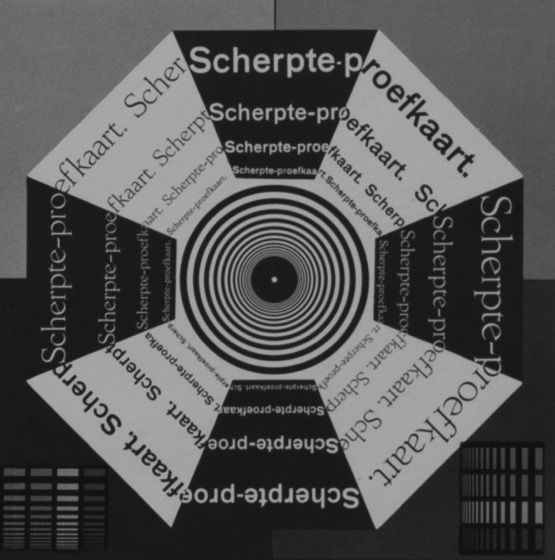
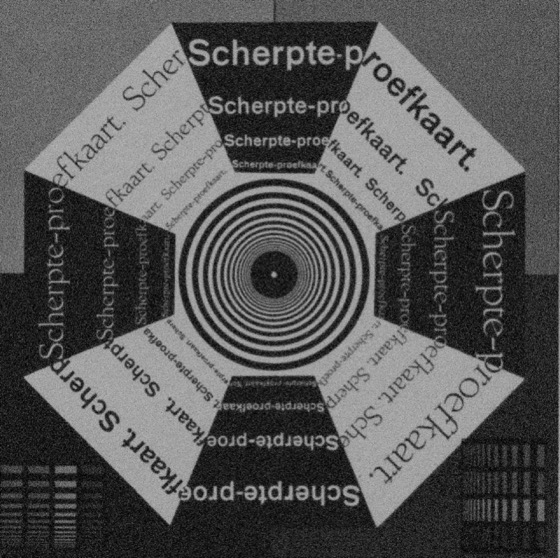
The definition of a lens/film (sensor) combination is a more useful concept as it combines resolution with overall contrast and edge contrast. Therefore a second test-chart has been used, one specifically designed to show small differences in detail definition and contrast. This is the Tirion chart, made of eight segments (alternating black and white) with characters of varying height and a central portion with concentric rings of diminishing width.
The processing software used has been Lightroom 4.1, Capture One Pro 6.4.3, After Shot Pro and Raw Developer (based on DCRaw). The results hardly differ and I used Raw developer because it is the simplest to use.
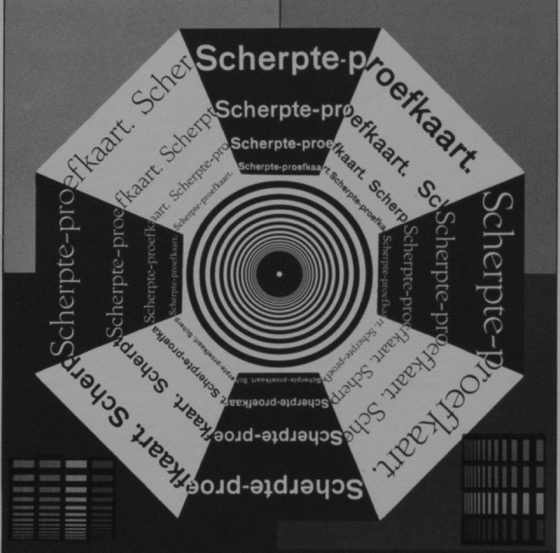
The Tirion test (it is really a discriminating test!) shows that the Monochrom can record small print that is almost twice as small as the M9 can. Note this does not imply a resolution figure that is twice as high! If we focus the attention to the central portion (the concentric rings) one will see that the number of rings that can be clearly distinguished is hardly different (in the original pictures there is a faint advantage for the Monochrom), but the big difference lies in the non-resolved segment: the M9 has severe moiré, and the Monochrom shows a fine homogeneous blurring equal to what one would see in a film emulsion.
Even if you change the M9 images to black and white the moiré is visible, but not as prominent.
Below: Tirion pattern M9 (small section of full frame)
Below: Tirion pattern Monochrom (small section of full frame)
The Monochrom produces absolutely neutral monochrome tones. The separate RGB values are identical when looked at in a post processing program. When you take a M9 image file and transfer it to black and white there is always a slight color cast. It is well-known that even the Epson 3800, when set to bw-printing, will add slight amounts of color ink. One can safely claim that the Monochrom is the only digital 35 mm camera that delivers pure neutral tones, identical to the ones you get when using silver-halide emulsions.
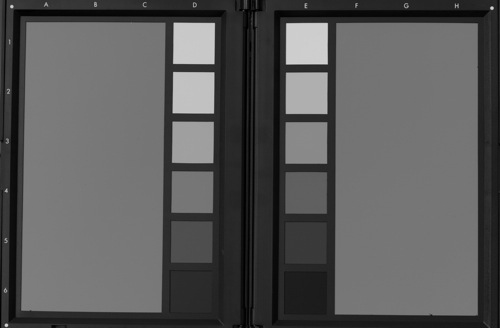
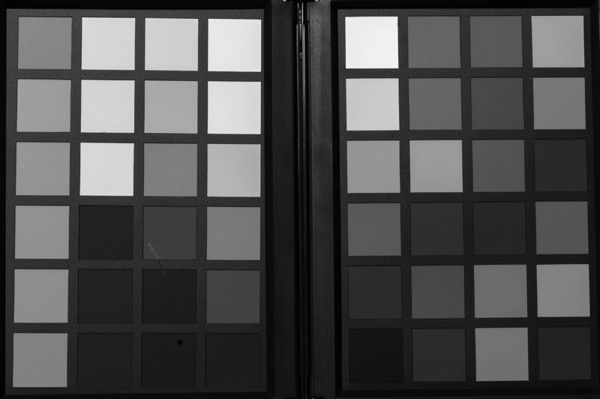
Below: the grey card with step wedge identical to Macbeth card
The remarkable difference between the M9 and Monochrom pictures is the overall contrast. The M9-P images show a higher contrast compared to the Monochrom. With film emulsions one would say that the Monochrom images have the characteristic curve of a current black-white emulsion and the M9 images have the characteristic curve of a current slide film. The exposure choices and strategy differ accordingly!
When working with the Zone System you produced your own characteristic curves with a range of exposures of a grey card (typically from +5 to -5 in one-stop increments, every stop has a value of 0.3). Then you measured the negatives with a densitometer and you would use the negatives with a density of 0.2 and 1.20 to find the zones II (some detail in dark area) and VIII (some detail in white area). The zones 0 and X correspond to the transparent and deep black negatives). The same procedure has been used for the Monochrom. Obviously the RGB values of 0 and 255 correspond to deep black and pure white. Establishing the values for Zone II and VIII is more arbitrary, but a diffuse highlight gets the value 248 and a just discernible dark grey next to pure black gets the value 15.
Below: the characteristic curve in classical style:
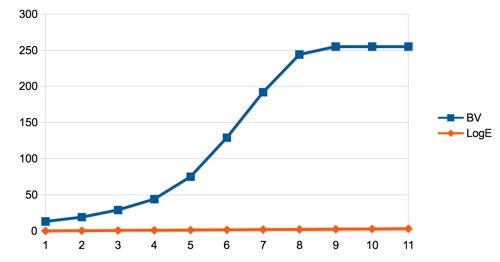
For this test I used the grey card from Datacolor (Checkr) and made a series of exposures that were measured in Raw Developer (a check was made with LR4). The results can be seen in the graph below. BV = brightness Value and LogE is relative Exposure in 0.3 increments. The numbers 1 - 11 represent the range in stops. This graph provides the bridge between the classical film curves and the digital opto-electronic conversion function (OECF). Now the values of 15 and 244 represent the useful dynamic range or scene brightness range that can be transferred to print. The corresponding LogE values are 2.1 and 0.15 and this represents a useful range of 6.5 stops. This result may seem disappointing when compared to claims that some digital cameras have exposure ranges of 10 - 12 stops, but these numbers have no practical value. The maximum white point is 255 and when the next three stops have values of 253, 251 and 249 you may calculate that there is a four stop exposure range, but in fact these values are so close that no one will see any difference in brightness in the print or on the monitor. At the black point you have the same situation, so one can subtract from the dynamic range of 12 stops easily 4 to 5 stops of not-useable brightness.
In current technical discourse only superlatives count. In practical situations common sense may prevail. Numerous studies have shown that normal scenes have a scene brightness range of 6.5 stops, almost identical to what the Monochrom can capture with the added advantage that the deep shadows and diffuse highlights show detail. If we accept that deep black areas and specular highlights do not show tonal detail, then the Monochrom is capable of capturing a scene with 8 stops, possible more.
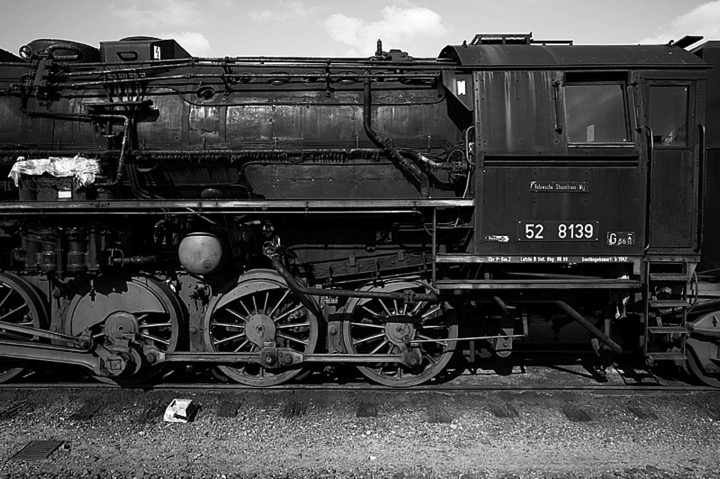
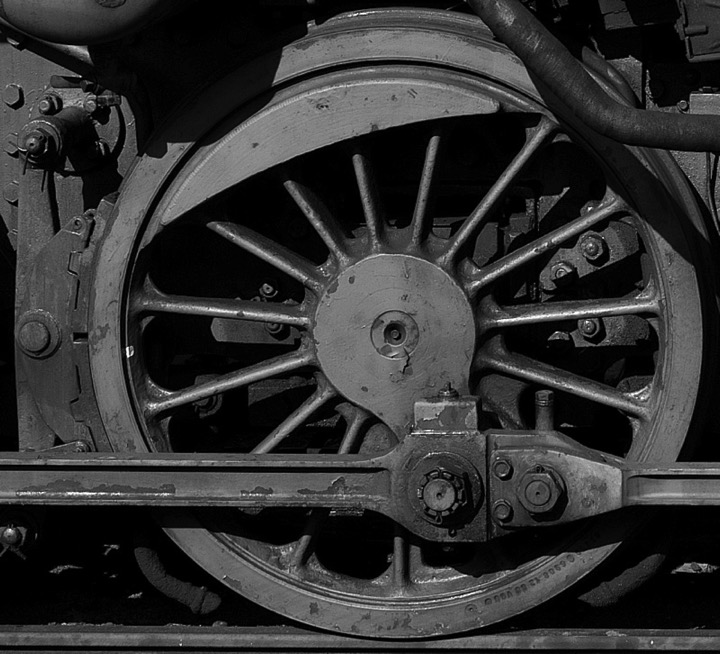
Below: a full frame picture of a locomotive and below that a selection to show the very fine definition and tonal scale.
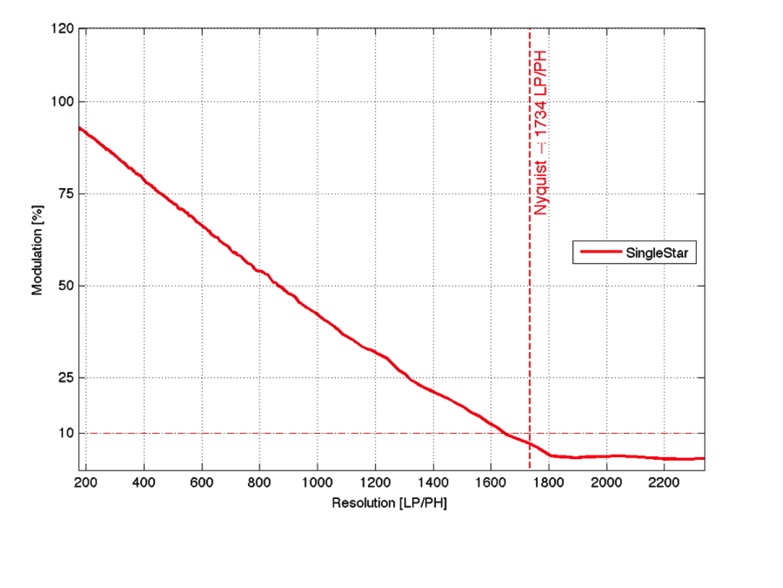
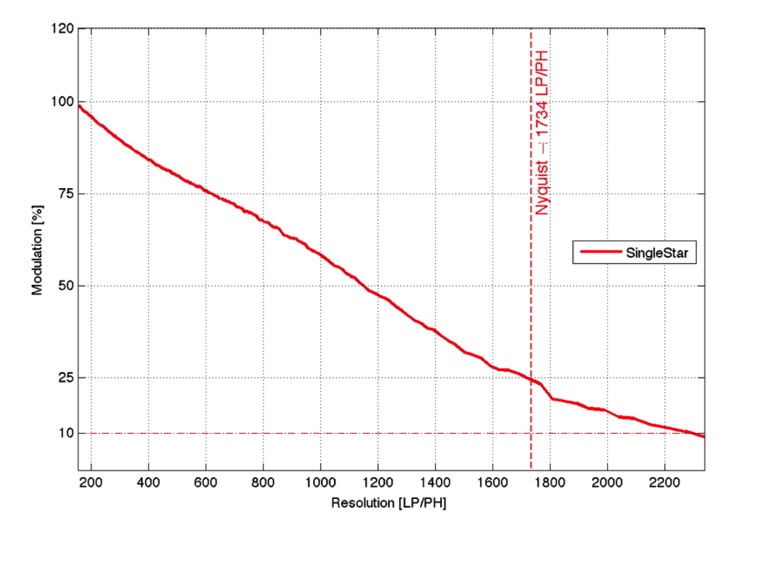
The high performance of the Monochrom can be demonstrated here with these results from the Siemens testchart.
Note that the Nyquist limit of 1734 LP/PH is equal to 74 LP per MM. To switch from LP/PH to LP/MM divide the numbers by 23.43. The critical 40 LP per MM equals 940 LP/PH. Note to that the M9-P has a clear cut-off at the Nyquist limit, but that the Monochrom keeps the performance till 2200 LP/PH or 94 LP per MM. Remember that all parameters (test chart, subject distance, aperture, lens, low ambient light are identical: the only change is the camera body.
Below the Summicron (IV) at f/2 attached to the M9-P
Below the Summicron (IV) at f/2 attached to the Monochrom
Noise
The basic sensitivity of the sensor has been set by the factory to an exposure index (EI) of 320. I am a bit reluctant to refer to ISO values because the method of establishing the true ISO value for digital capture media is not as transparent as the comparable method for silver-halide materials. With the use of the Gossen Digisky and the grey-card a practical procedure can be established and this one concludes that at the value of 320, the Monochrom slightly under-exposes by a third stop. For maximum shadow detail one can over-expose by a full stop (or use the Pull option in the ISO selection menu). At EI 320 the camera is at its optimum performance, and the EI 640 has almost the same quality with a slight increase in grain (noise in digi-speak). EI 640 is the classical value for pushed Tri-X film. The M Monochrom at this speed and with the Summilux-M 1.4/35 mm ASPH might be the optimum solution for Leica-photographers who wish to emulate the famous picture culture of the 1950s.At EI 1250 the noise starts to blur the finer details, but is still eminently usable, as is the EI 2500: the noise is now very well visible, especially in the darker areas. Noise reduction programs will make the noise almost invisible, but definition will loose and so does the emotional and visual value of a slightly grainy (silver) picture. At EI 5000 the noise is becoming obtrusive and at EI 10000 the noise/grain is almost oppressive and both speeds should be reserved for emergency situations. The conclusion might be that the Monochrom offers excellent quality even at speeds around EI3200, the classical domain of the Kodak T-Max 3200 and Ilford Delta 3200 Professional.
Below EI 320
Below EI 1250
Below EI 10000
Tonal reproduction
The Datacolor Checkr consists of two parts: on the right the traditional Macbeth color patches and on the left a new addition: six skin tones and a range of low to medium saturated colors, which are quite difficult to capture on black and white film emulsions without using filters. Here I present only the straight reproductions (from top to bottom):
BW conversion of color chart in LR4.1
Color chart as seen by M Monochrom (without filter)
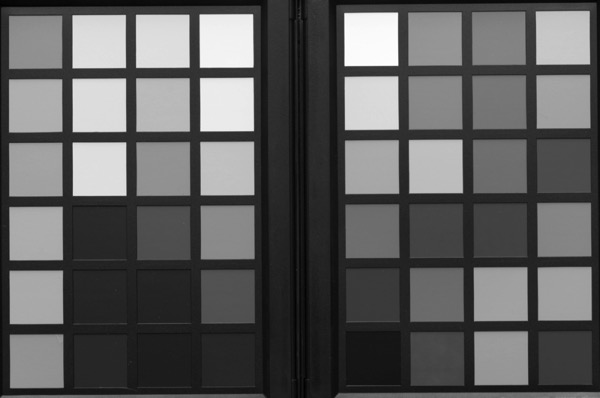
Color chart as seen by Delta 100 (without filter)

The translation of the color patches into grey tones depends on a number of factors: spectral sensitivity of the receptor, the use of filters, the steepness of the gradation and the exposure. It is too simple to state in this stage of the analysis which technology produces the finest tonal scale. On a basic theoretical level one can say that the important feature of black and white emulsions and digital receptors is to reduce the number of tonal values in order to emphasize composition and detail. In addition we have the objective and the subjective tonal reproduction. The first one tries to find a 1:1 relationship between the luminance values of the colors in the original scene and the density values of the black-and-white print. The second one tries to produce density values in print that emulate the visual experience of the photographer.
The three methods, presented here, differ in their results. Compare in particular the Monochrom reproduction and the black-white conversion of the colored M9 picture. Which one is preferable or the best will become a matter of much debate.
Leica M Monochrom: tonal scale and spectral sensitivity
The Leica M Monochrom (LMM) is capable of the capture of seven to eight stops of contrast between the specular highlight and the deep black. As the accompanying chart shows (below) there is a finely graduated tonal change in the highlight to mid grey section, but the darker tones show minimal differentiation in the deep shadows. The maximum contrast range should not be over-estimated. There is a tendency nowadays to assume that a camera needs at least 9 to even 12 stops for serious picture taking. A glance at the Zone System shows that the most important range lies in the five stops difference around the medium grey. (the Zone System does not specify the medium grey (Zone V), because the choice of what grey value should be assigned this Zone V value is user-dependent. The Kodak chart has a theoretical contrast range of six stops, but in practical use the total contrast is lower. The final result however should please any LMM worker.
The basic tonal reproduction on the other hand leaves room for improvement. Below is a small section of the Macbeth color chart: the blue-green-red-yellow range. It is clear that there is no difference in brightness value between the blue and red patches and the green patch is too dark.Using a yellow filter improves the matter, but not enough. A yellow-green filter changes the relative brightness values and the green filter produces the most differences between the color patches. The choice between green and yellow-green is a matter of personal preference, because the brightness of the blue still is close to that of the red patch.
Below are the values as reported within LR 4.2 (the percentage values have been related to blue which has been set to 1 in all cases).
blue-green-red-yellow: no filter: 1.0-1.4-1.0-2.21
blue-green-red-yellow: yellow filter: 1.0-2.1-1.47-3.43
blue-green-red-yellow: yellowgreen filter: 1.0-2.07-1.26-3.3
blue-green-red-yellow: green filter: 1.0-2.32-1.25-3.57
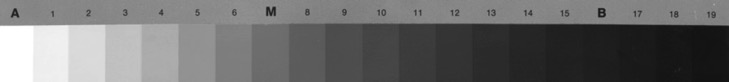
Below: macbeth patches: no filter
Far below: macbeth patches: green filter


I also used the Lightroom filter set on the no-filter image and got these results:
blue-green-red-yellow: yellow filter LR: 1.0-1.5-1.02-2.56
blue-green-red-yellow: green filter LR: 1.0-1.47-0.98-2.40
It is clear that the software-based filters are not as effective as the glass-based filters.
With the LMM the use of glass filters for the lens is a necessary component in the workflow. The art of selecting the appropriate filter, after studying the color composition of the scene and the required tonal reproduction, once expert knowledge, but now as rare as the Bushmen insights into healing receipts, has to be revived. Even photographers who only use M8 and M9 color images and convert these files to black-and-white images can profit from knowledge about different brightness values of the color spectrum.
The film emulsions have a different spectral sensitive. Below the values of the Ilford Delta 100, measured with the Heiland densitometer. The higher the number, the brighter the patch.Without a filter the blue and green patches of the Macbeth chart are almost identical in density, but red is darker and yellow much lighter: 1-1.05-0.75-1.50
The yellow filter corrects the problem: now red is much darker than blue, green is light and yellow even lighter: 1-1.83-1.46-2.6
The yellow green filter makes subtle differences: Yellow is brighter and red somewhat darker: 1-1.85-1.38-2.9
The green filter is expected boosts the green patch and blue and red are somewhat less different than with the yellow green filter: 1-2.08-1.20-2.93
The interesting difference between film and the LMM is the spectral sensitivity of the blue, green and red patches: the LMM shows no difference between red and blue and the Delta100 shows no difference between blue and green. The choice of filters is a matter of personal preference and of relative importance of the colors in the scene.